
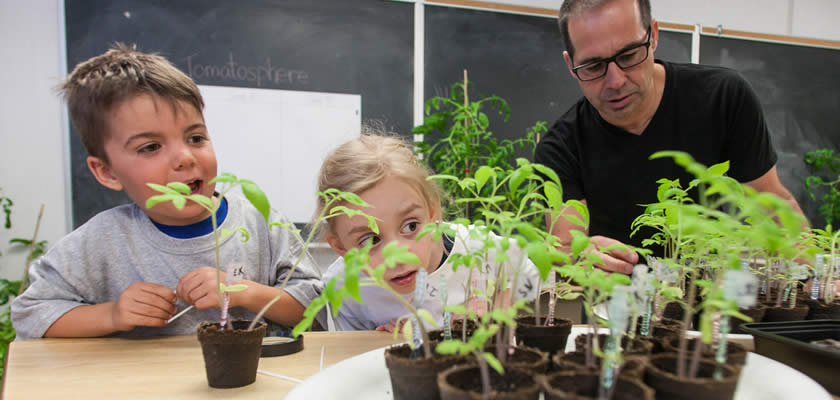


How does outer space affect plants and seeds? Join Tomatosphere™, a free program where Kindergarten to Grade 12 students use "space" tomato seeds to learn about plants in space, right here on Earth. Tomatosphere™ engages students in real scientific processes that teach and reinforce inquiry skills, while they explore concepts related to plants, space, careers, nutrition and agriculture. Register for the program and join classrooms nationwide to contribute to the expansion of knowledge for long term space travel.
The consortium of partners who oversee Tomatosphere™ include the Canadian Space Agency, HeinzSeeds, Let's Talk Science (operations in Canada), First-the-Seed Foundation (operations in the United States), Stokes Seeds, and the University of Guelph. Tomatosphere Trademark owned by University of Guelph.
Comment les conditions de l'espace affectent-elles les plantes et les semences? Participez à TomatosphèreMC, un programme gratuit où les élèves de la maternelle à la 12e année partout au Canada utilisent des semences de tomates « de l'espace » pour étudier les effets de l'environnement spatial sur leur germination. Le projet TomatosphèreMC permet aux élèves de participer à une vraie expérience scientifique et de développer des compétences d'enquête tout en explorant des sujets reliés aux plantes, à l'espace, à la nutrition, à l'agriculture et aux carrières dans ces domaines. Inscrivez-vous en ligne afin de vous joindre aux écoles à travers le pays qui participent à l'expansion des connaissances sur les voyages spatiaux de longue durée.
Le consortium de partenaires qui supervisent TomatosphèreMC comprennent l'Agence spatiale canadienne, HeinzSeeds, Parlons sciences (activités au Canada), First the Seed Foundation (activités aux États-Unis), Stokes Seeds et l'Université de Guelph. L'Université de Guelph est titulaire de la marque de commerce TomatosphèreMC.